GUIDEBOOK · CEA v4.0
Emissions
Emissions
Overview
Calculates greenhouse gas emissions for each building and district plant across the full building lifecycle. Produces both lifecycle emissions (embodied + operational over the building’s lifespan) and operational emissions (hourly emissions from energy system operation).
What It Calculates
Embodied (Production) Emissions (kgCO2e):
- Building envelope construction (walls, roof, floor, windows)
- Technical systems (HVAC equipment)
- PV/PVT/SC panel manufacturing (if configured)
Operational Emissions (kgCO2e):
- Per energy carrier (grid electricity, natural gas, oil, coal, wood)
- Per service (space heating, space cooling, DHW, electricity)
- District heating and district cooling (including pumping)
- Hourly timesteps (8,760 hours)
Biogenic Carbon (kgCO2e, negative):
- Carbon stored in timber and bio-based building materials
Demolition Emissions (kgCO2e):
- End-of-life processing at the building’s demolition year
Solar Offset Emissions (kgCO2e, negative):
- Grid emissions avoided by on-site PV/PVT/SC generation
Lifecycle Timeline:
- Year-by-year emissions from construction year through demolition
- Supports grid decarbonisation projections
Prerequisites
- Final Energy completed for the what-if scenario
- Solar radiation data (for PV-related embodied emissions)
- Zone geometry and building properties
Key Parameters
| Parameter | Description |
|---|---|
| What-if name | Which final-energy scenario to calculate emissions for |
| Grid decarbonisation reference year | Base year for grid emission factor (optional) |
| Grid decarbonisation target year | Target year for reduced grid emissions (optional) |
| Grid decarbonisation target emission factor | Target kgCO2/kWh at target year (optional) |
| Grid carbon intensity dataset CSV | External 8760-row hourly grid intensity file (optional) |
How to Use
-
Run Final Energy first for the what-if scenario
-
Run Emissions:
- Navigate to Life Cycle Analysis
- Select Emissions
- Select the what-if scenario
- Optionally configure grid decarbonisation trajectory
- Click Run
-
Processing time: 2-10 minutes for typical districts
Output Files
All outputs are under {scenario}/outputs/data/analysis/{what-if-name}/emissions/:
| File | Description |
|---|---|
emissions_buildings.csv | Per-entity lifecycle totals (production, operation, biogenic, demolition) |
emissions_operational.csv | District-level hourly operational emissions (8760 rows) |
emissions_timeline.csv | District-level yearly lifecycle timeline |
operational/{building}.csv | Per-building 8,760-row hourly operational emissions |
timeline/{building}.csv | Per-building yearly lifecycle timeline |
Understanding Results
- Buildings using DH/DC show zero operational emissions at building level; actual emissions appear on the plant row as district heating/cooling emissions
emissions_buildings.csvcontains lifecycle totals (operation column sums the full lifecycle, not a single year)- Timeline files show year-by-year breakdown, useful for tracking trajectories toward net-zero
- Grid decarbonisation linearly interpolates emission factors between reference and target years, reducing operational grid emissions over time
Troubleshooting
| Issue | Solution |
|---|---|
| Very high embodied emissions | Check material quantities in architecture file are realistic |
| Zero operational emissions | Ensure final-energy calculation completed; check supply systems are defined |
| Missing biogenic carbon | Verify timber content in architecture file; check database includes biogenic factors |
Plot - Lifecycle Emissions
Overview
Creates stacked bar charts showing total lifecycle emissions per building, combining embodied, operational, biogenic, demolition, and solar offset categories.
What It Shows
- Positive bars: operational emissions by service + embodied (production, demolition)
- Negative bars: biogenic carbon, PV/PVT/SC offsets
- Title includes the lifecycle year range (e.g. “CEA-4 Lifecycle Emissions (1926 - 2088)”)
- Net-zero buildings show positive and negative bars roughly equal
Key Parameters
| Parameter | Description | Options |
|---|---|---|
| What-if name | Which scenario(s) to plot | Multi-select |
| Y unit | Emission unit | kgCO2e, tCO2e |
| Normalise by | Normalisation | None, Gross floor area |
| Include | Entity filter | Buildings, Plants, or both |
Legend Labels
| Legend Name | Meaning |
|---|---|
| Electricity | Grid electricity operational emissions |
| Space Heating | Heating system operational emissions |
| Space Cooling | Cooling system operational emissions |
| Domestic Hot Water | DHW system operational emissions |
| District Heating | DH plant operational emissions (incl. pumping) |
| District Cooling | DC plant operational emissions (incl. pumping) |
| Production | Embodied construction emissions |
| Biogenic | Carbon stored in bio-based materials (negative) |
| Demolition | End-of-life emissions |
| PV Offset | Grid emissions avoided by PV (negative) |
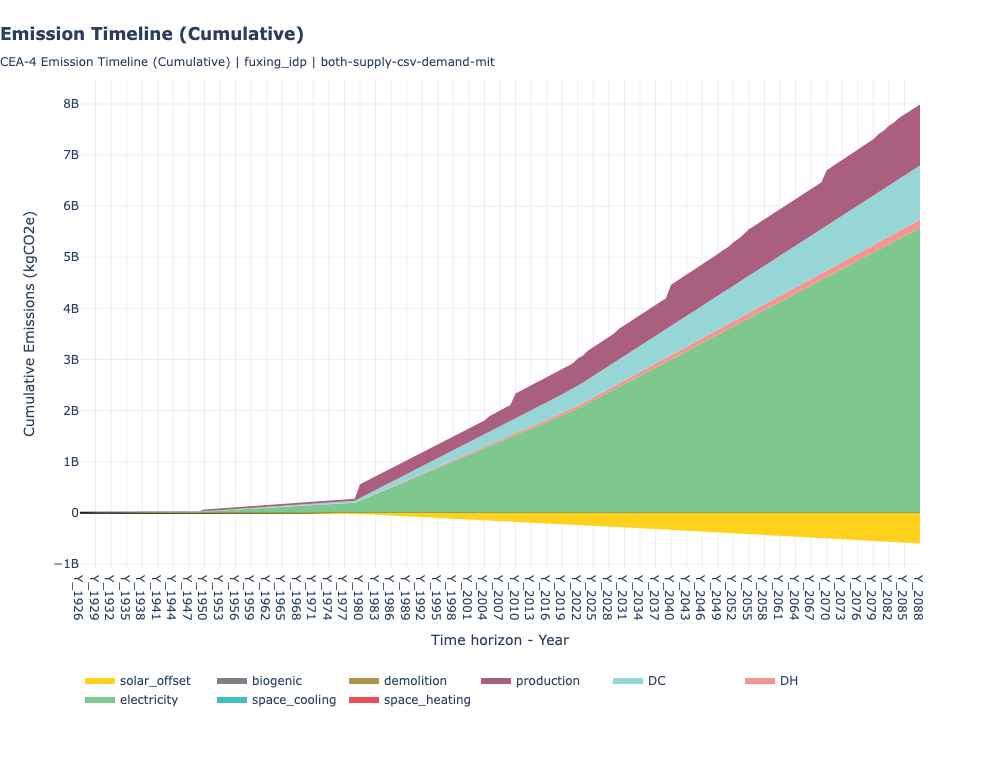
Plot - Emission Timeline
Overview
Visualises how cumulative emissions evolve over time across the district, tracking the trajectory from construction through demolition.
What It Shows
- Cumulative stacked area chart over the lifecycle year range
- Construction spikes (embodied), steady operational accumulation, demolition at end-of-life
Example
Cumulative emission timeline showing district emissions over the building lifecycle:
Key Parameters
| Parameter | Description | Options |
|---|---|---|
| What-if name | Which scenario to plot | Single select |
| Y unit | Emission unit | kgCO2e, tCO2e |
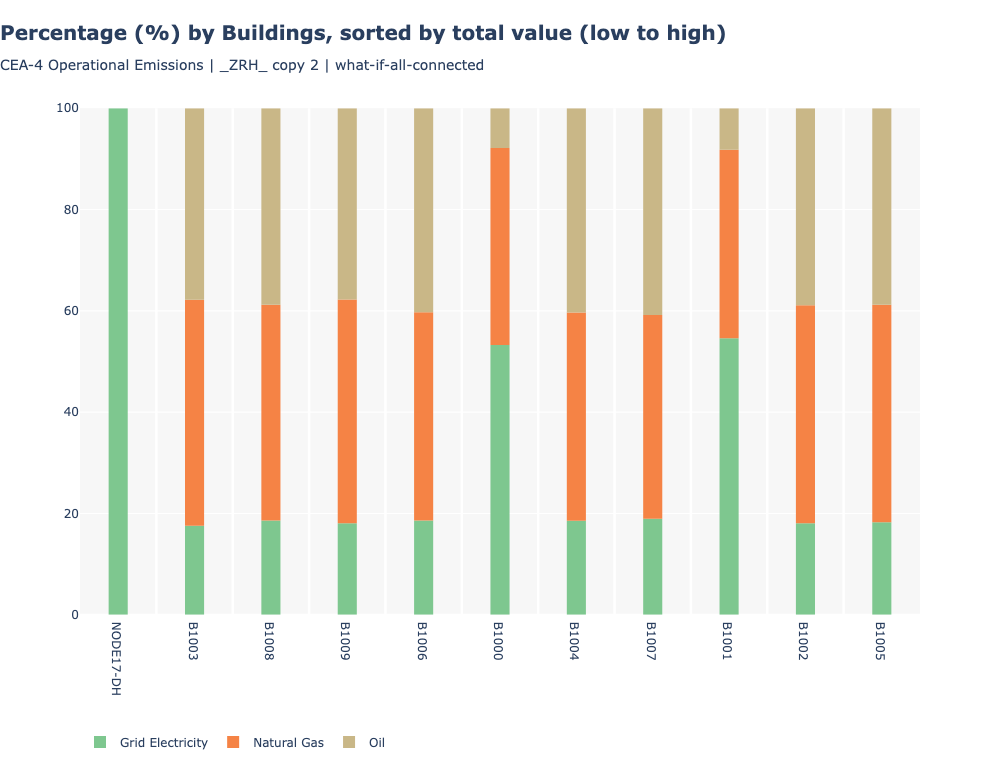
Plot - Operational Emissions
Overview
Creates bar charts of operational emissions from energy system operation, with breakdowns by service and/or energy carrier.
What It Shows
- Per-building operational emissions (annual or time-series)
- Breakdown by service or by carrier
- Solar offset emissions (shown as negative)
Example
Operational emissions by energy carrier (percentage breakdown per building):
Key Parameters
| Parameter | Description | Options |
|---|---|---|
| What-if name | Which scenario(s) to plot | Multi-select |
| Y category | Breakdown type | By operation (service), by energy carrier, or both |
| Y unit | Emission unit | kgCO2e, tCO2e |
| Normalise by | Normalisation | None, Gross floor area |
| X axis | View type | By building, by month, district hourly, etc. |
| Include | Entity filter | Buildings, Plants, or both |
Related Features
- Final Energy - Prerequisite (must run first)
- System Costs - Economic analysis of the same what-if scenario
- Heat Rejection - Environmental heat impact
- Visualisation - Additional plotting tools
<- Back: Final Energy | Back to Index | Next: System Costs ->
Source: view raw on GitHub ↗